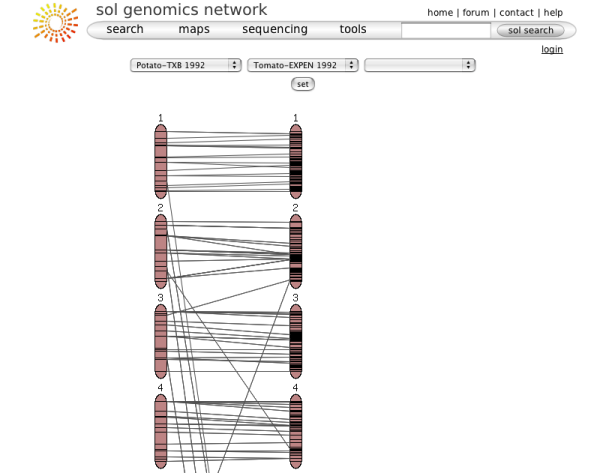
The comparative
viewer is a tool for displaying, browsing, and
comparing map information on SGN.
Map overview page
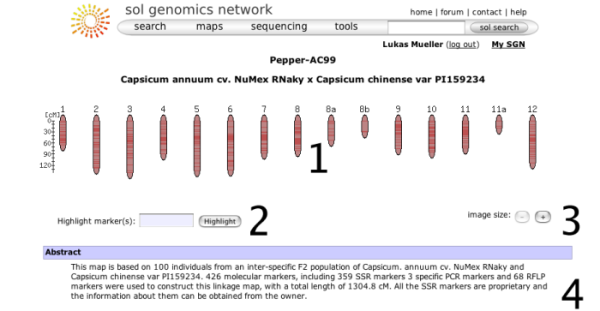
When choosing a map from the map menu, the map overview page will be displayed. It shows some overview information about the map and allows the map to be queried with marker names. The basic elements on this page are:
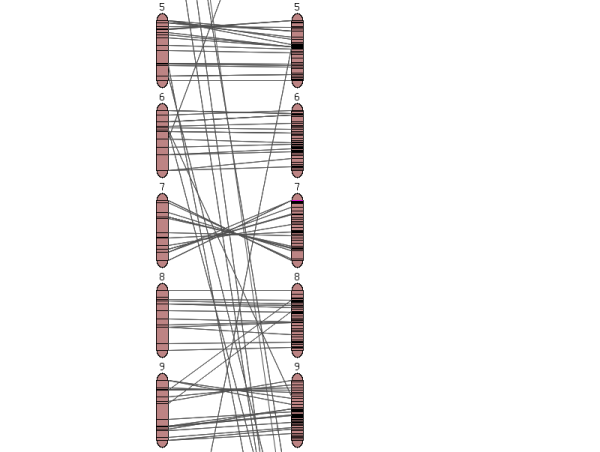
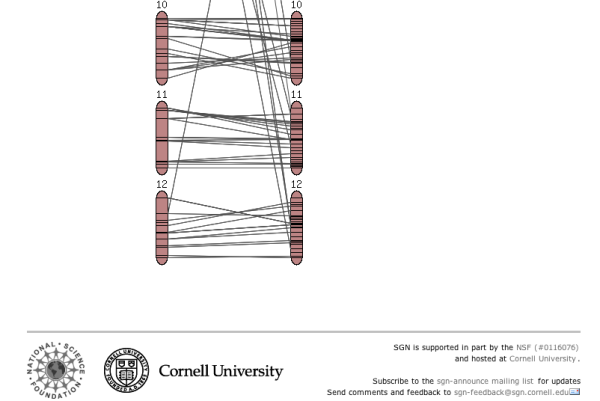
- A small overview graph with all the chromosomes in the map that illustrates the marker density of each linkage group. The glyphs are clickable and will open the clicked chromosome in chromosome detail view.
- A text box that can be used to locate markers on the map - you can highlight multiple markers by entering marker names separated by spaces.
- Size increase/decrease, to change the display size of the map.
- The abstract gives more details about the origins, submitters, and methodologies of the map.
- A list of chromosomes in the map along with the number of markers located on the map.
- Statistics about the marker collections, such as COSII markers.
- Statistics about the different assay protocols that were used to construct the map, such as RFLP markers or CAPS markers.
- User comments. Any logged in user can leave a comment about the map displayed. The comment feature is not available on all maps.
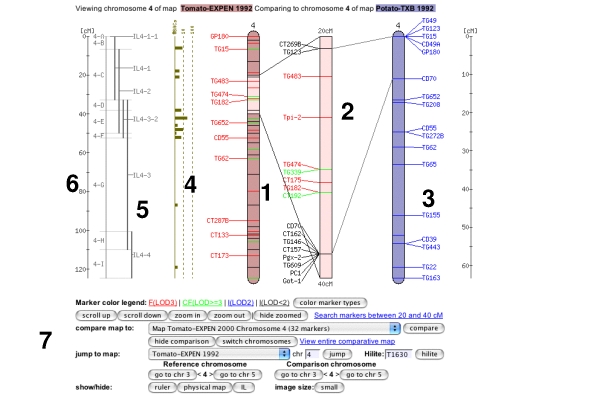
The chromosome view
Clicking on one of the chromosome glyphs on the overview page will bring up the chromosome view. In this view, a chromosome is displayed in its entirety, but most of the marker names will be hidden because on most maps there are too many markers to be displayed. To see all the markers, the map can be zoomed into by clicking on a point of interest. This will bring up a zoomed-in view alongside the chromosome. The chromosome can also be compared to another chromosome of another map by choosing a comparison chromosome from the list.
A typical image from a chromosome view is shown in the figure above (the exact rendering of the buttons will depend on the platform and browser used).
The different screen elements are:
The reference chromosome, always shown in
red. The chromosome number is given on the top
and approximately a dozen selected markers are
drawn according to their map position. The other
markers on the chromosome are only identified by
tickmarks. They can be viewed by clicking anywhere in the
chromosome reference chromosome, which brings up the zoomed-in map
(2), in which all markers are displayed in the
given interval. For certain maps, the reference chromosome can have
additional information displayed, such as IL line
information, a ruler, and physical map. The zoomed in map displays a section of the
reference chromosome, showing all markers at the
current score cutoff. The marker names can be
clicked to reach the marker detail page. A gray
dot next to the marker names means that an overgo
probe has been developed for this marker. A red
dot means that BACs have been anchored to the
overgo developed from this marker. Clicking on
the red dot shows all the anchored BACs and which
FPC contigs they fall into. The comparison chromosome. It can be selected
using the pulldown menu in the toolbar (7), and
then clicking 'compare'. Only markers that are on
the reference map are displayed with their names, the other
markers are shown by a tick mark only. The marker
names can be clicked to view the corresponding
marker detail page. If all markers are of
interest in the comparison chromosome, the button
'switch chromosomes' can be clicked. The
comparison chromosome takes the place of the
reference chromosome and vice versa. If the physical button is clicked in the
toolbar (7), the physical map is displayed, which
shows how many BACs have been anchored to the
genetic map using the overgo process. The
physical map can presently only be viewed for the
Tomato EXPEN2000 and Tomato EXPEN 1992
maps. If the IL button in the toolbar (7) is
pressed, the chromosome sections of the
corresponding IL lines are displayed. The IL
lines can currently only be viewed for the Tomato
EXPEN 1992 map. Rulers can be activated by pressing the ruler
button in the toolbar (7). The Toolbar. It is divided into five
sections.
The marker coloring options. This line
contains a button for changing the coloring
either according to score of the marker or by
marker type. The different LOD scores can be
clicked and markers of lower LOD scores will
be hidden. Scrolling and Zooming. This line contains
buttons for scrolling up and down, zooming in
and out, and toggling between hide and show
zoomed. It also contains a link that will
perform a database search for all markers on
the zoomed-in chromsome section. Compare map to: A pulldown menu allows
the selection of a map that shares markers
with the current reference map. The pulldown
menu is sorted such that the topmost entry
has to most shared markers. Clicking the
'compare' button will display the selected
comparison map. Jump to different map or chromosome. Also
contains a input box to hilite markers on the
chromosome. This only hilites markers on the
currently shown chromosome. show/hide functions: Allows the toggling
of the rulers, ILs, and physical map, and to
select the image size. The smaller image size
is ideal for smaller screen, such as
laptop screens.
|